In this tutorial, you're going learn how to add dynamic data to each graph created using ChartJS free library. With the help of OWL Javascript Framework and action services, we can retrieve data from the database using only pure javascript.
This will be the last part of our Odoo custom dashboard tutorial. If you haven't checked my previous tutorial, you can watch the video below before proceeding to this tutorial.
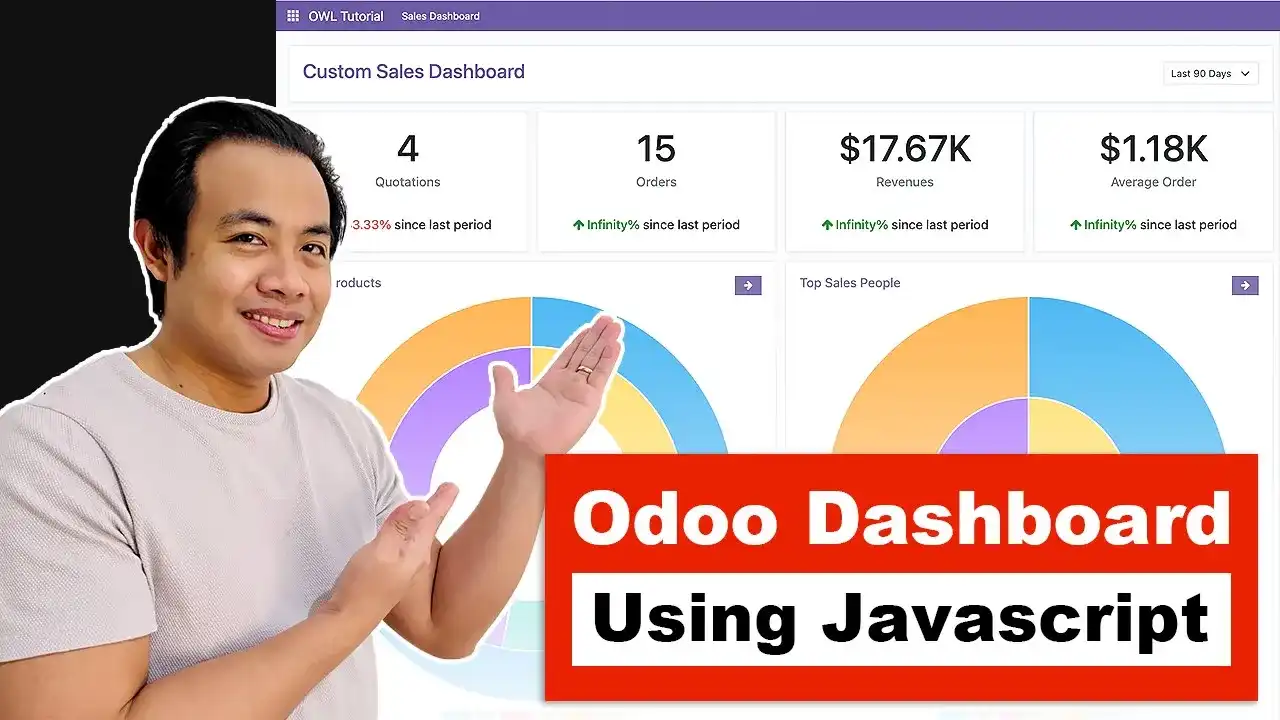
During the first part of this tutorial series Open , we have created different graphs. A single component has been created so that we can just call this component and pass different datasets and configurations. However, the data are still static.
Prepare the Component States
Under chart_renderer component, we have the data property having static values. Now we are going to make this as dynamic by passing the values from the database. But first we need to prepare all the needed state to avoid errors to each graphs.
Instead of creating the states in setup method, we can just initialize it to the new methods that will be created. Provided, we need to call this at the onWillStart life cycle method. We have 4 charts so we need to create four methods for - Top Products, Top Sales people, monthly sales and partner orders.
static/src/components/sales_dashboard.js
js
Show or Hide Code
/** @odoo-module */
import { registry } from "@web/core/registry" import { KpiCard } from "./kpi_card/kpi_card" import { ChartRenderer } from "./chart_renderer/chart_renderer" import { useService } from "@web/core/utils/hooks" const { Component, useState, onWillStart } = owl
export class OwlSalesDashboard extends Component { // top products async getTopProducts(){ this.state.topProducts = {} }
// top sales people async getTopSalesPeople(){ this.state.topSalesPeople = {} }
Under sales_dashboard template, add new props config is equal to state.topProducts and do the same to top sales people, monthly sales and partner orders.
Now in getting the data, we need to search it under sale order line model. However, we have date filter in our dashboard and the order date is coming from sale order model. But instead of creating a new controller or new methods in the model, Odoo already has existing sales report. This report combines sale order and sale order line wherein all of the fields we need are already here. For top products, we need the product, Total and order date.
Top Products
To get the top products, we need to group the report by product and use total as the measure. To achieve the same thing, use the read group ORM method. Pass sale.report as the model name, add same domain in getOrders method, get fields product_id and price_total and add product_id in group_by field.
Since we have multiple records, ChartJS by default just pickup random colors but it will not check for duplicate colors. In this case, we need to import getColor from Odoo. Basically, it's a list of colors that we can get based on an index.
Then we need to limit the number of products by adding additional object parameter and add limit to 5. If we limit it to 5, we then need to make sure that we get the top products by adding order by option. Let's add price_total, space and use descending order.
static/src/components/sales_dashboard.js
js
Show or Hide Code
//... import { getColor } from "@web/views/graph/colors" //... async getTopProducts(){ let domain = [['state', 'in', ['sale', 'done']]] if (this.state.period > 0){ domain.push(['date','>', this.state.current_date]) }
For top sales people, just copy the same code in getTopProducts method and replace it with topSalesPeople and also the product_id field to user_id. For this we want only the total amount so remove the other dataset.
xml
Show or Hide Code
//... async getTopSalesPeople(){ let domain = [['state', 'in', ['sale', 'done']]] if (this.state.period > 0){ domain.push(['date','>', this.state.current_date]) }
For monthly sales, copy the same code from getTopProducts method. But this time, it's little bit complicated since we need to show both quotations and sale orders by grouping them by date and state. For monthly sales, copy the same code from getTopProducts method. But this time, it's little bit complicated since we need to show both quotations and sale orders by grouping them by date and state.
We need to add draft and sent state in the domain so that we will not get cancelled state. Then under fields, we want to get the date and the state and the same with the group by fields. Remove the limit and for the order by, replace it with date field. Since, this will give both quoations and order, we need to filter the data before passing the values to datasets. For the background, we don't need a random color so just make the quotations as red and orders as green.
However, the filter is not yet enough since we still need to merge the amount of the same month. But this get's more complicated since we also need to match the key of this values to the key of the labels in order to match. Say for example, we don't have values in next month, so the value should be automatically set to zero and the current month value will move to the next.
static/src/components/sales_dashboard.js
js
Show or Hide Code
//... async getMonthlySales(){ let domain = [['state', 'in', ['draft','sent','sale', 'done']]] if (this.state.period > 0){ domain.push(['date','>', this.state.current_date]) }
In the above code, we need to store the labels, quotations and orders into their respective variables. Then in the datasets, first we need loop in each label using map function, and look to quotation/orders list that matches the current label which is the date using filter function. Whatever the result, we need to get only the the price_total which will be stored in an array and finally using reduce function to take the sum of each value with a default value 0.
Partner Orders
For partner orders, we are going to combine bar chart and line chart. Since this is partner orders, we need to get partner_id, as well as in group by fields and order by. For the fields, get price_total for bar chart dataset and product_uom_qty for line chart dataset.
Since both datasets are using the same scales, it will make the line graph very low. To solve this issues, we need to define an yAxisID of both y axis. In order to move the line chart at the top, add order as 0 and 1 for bar chart. The lowest order value will be at the top.
To move the line graph scale to the right, define a new property scales and pass the line graph yAxisID and add position property to right. Using this scales object, add scales property to chart renderer component.
static/src/components/sales_dashboard.js
js
Show or Hide Code
//... async getPartnerOrders(){ let domain = [['state', 'in', ['draft','sent','sale', 'done']]] if (this.state.period > 0){ domain.push(['date','>', this.state.current_date]) }
Next, is to add on onClick event to each graph that will redirect to the actual records. Under our chart_renderer component, the way we add on on click event is under options property. The value will be an arrow function with e as a parameter so that we can access all the charts available properties.
To get the active datasets and labels being clicked, we need to call getActiveElements method. This will give you the label index and dataset index which you can use to retrieve records from chart data object.
We will be using action service to redirect the page to the actual records. For the domain, we need to get it from sales_dashboard component since each graph has already existing domain and define the name of the field.
But we have issue if the label is date, so if the label field includes string date we need to format it to date format. First step is to convert the date string to timestamp using Date.parse method. Then create a new variable selected_month is equal to moment and pass the timestamp. Thanks to moment js, we now have lot's of options with this date.
Finally, using the dataset index, add an if statement if what dataset has been clicked. In monthy sales report, it's either qutations or oders.
In order to for the graphs to re-render once we select any filter, we need to import useEffect method from owl. This method will be used to trigger some function once any state changes.
We also need to destroy existing chart before creating a new chart. Lastly, we need onWillUnmount method from OWL to destroy the chart when the component has been unmounted.
Since Odoo already has existing ChartJS using older version, it will then conflict to the new version we are using in this totorial. The easiest way is to use Odoo default version under web/static/lib/chart/chartjs.
But we need to change some of the codes like the partner orders having two types of graphs. Since we will use older version, we need to use existing code which Odoo uses under web/static/src/views/graph/graph_renderer.js.
We then need to comment existing code to the onClick event to match with the code from Odoo.
static/src/components/sales_dashboard.js
js
Show or Hide Code
//... export class ChartRenderer extends Component { setup() { //...
In case you want to use the newer version, one solution is to reload the page once the older version has been detected. To do that, we need to search the dom with a script that has the src from web/static/lib/chart/chart.js. If there is, then just reload the page.
We need to import browser and routeToUrl methods from web core browser. We also need to import the router service so that we are able to get the current url and so that we can modify the search parameter
Then we tell the browser to use this new url using browser.location.href is equal to browser.location.orgin + routeToUrl and pass router.current. This routeToUrl will convert router.current object to url
static/src/components/sales_dashboard.js
js
Show or Hide Code
//... import { browser } from "@web/core/browser/browser" import { routeToUrl } from "@web/core/browser/router_service"
export class OwlSalesDashboard extends Component { //... setup(){ //...